Below we very briefly present some of the results from flight 3. The results are preliminary as we are currently preparing them for publication. Also we omit much of the interpretation and refer you to our upcoming publication.
The goal of the experiment was to observe diffuse emission in the band from 0.05-1keV with high spectral resolution. A preflight calibration spectrum using on-board radiation sources was acquired from T-3 hours to T-4 minutes before launch while the rocket was on the launch pad. The spectrum is shown below:
The payload was launched on its third flight on March 28, 1999 to observe
a one steradian field near the northern galactic pole at 90, +60 in galactic
coordinates. A ROSAT image of the x-ray sky at 3/4 keV is shown below.
The on-target field of view of the instrument is shown as the solid line
in the upper left hand quadrant.
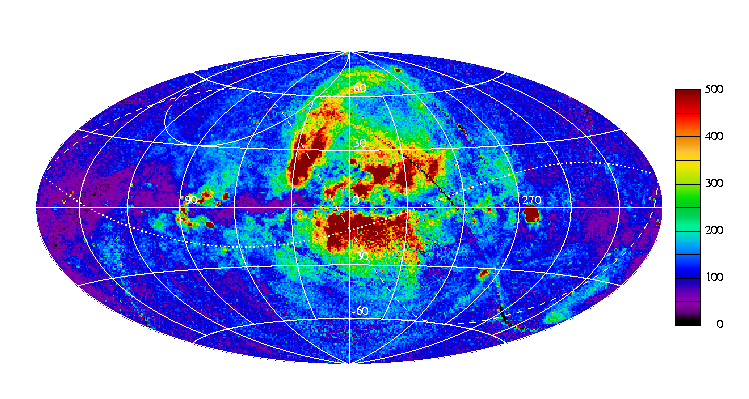
Half-way through the flight the rocket makes a 360 degree rotation scanning
across the earth and then returning to the on-target position. The path
of the scan across the sky is shown as the dashed line above. The reason
for scanning across the earth is to obtain a measure of the in-flight background.
Historically, some flights have seen a high particle background from precipitating
electrons in the upper atmosphere.. Below we show the count rate as a function
of time for our flight. The count rate drops to nearly zero during the
earth eclipse indicating a very small in-flight background for this flight.
After emerging from earth occultation and on the way back to the on-target position, the instrument made a serendipitous observation of the north polar spur for 15 seconds. The north polar spur is a bright region of Loop 1, a super bubble in our galaxy formed by one or more supernova explosions. There were not many counts obtained during the short exposure time, however line emission from highly ionized oxygen (OVII, OVIII) and Fe (XVII) are clearly visible:
We are continuing to analyze and interpret the data, removing a few remaining systematic issues. We are preparing the results of this analysis for publication in the Astrophysical Journal.
This page written and maintained by F. Scott Porter (email:
Frederick.S.Porter@gsfc.nasa.gov)
Responsible NASA official: F. Scott Porter (email:
Frederick.S.Porter@gsfc.nasa.gov)
NASA Homepage.